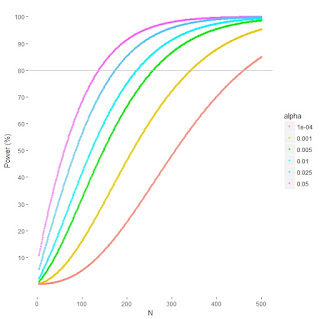
I tweeted a couple of scatterplots today. One shows the relationship between N and power, for 6 alpha levels. I don't know why I made it, really. I'd recently cracked some code for automating power estimates with the pwr package in R and I had a day off so I thought I'd put it to use. It might be of interest to anyone with an interest in the recent alpha debates. It displays power for the average effect size in personality and social psychology (r = .21) by N by alpha. The takeaway from the graph is that N needs to increase as alpha decreases. This is all totally unsurprising, of course, and usual caveat about power being a highly theoretical concept applies.
Anyway. The code is below. It can be modified quite easily, I expect, to help answer other questions. Change rs, alphas, Ns, to investigate other things.